Transition 2 in the frame with Windows
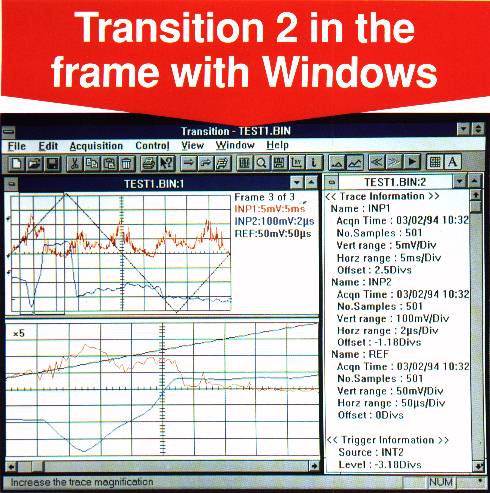 |
Transition 2 is a Microsoft Windows based application software package designed to transfer data easily and efficiently between Gould DSOs and a PC. The new package is especially suited to the production of reports, and for providing the 'gateway' for data analysis. Compared with the original version of the successful Transition product, Transition 2 offers a number of user benefits, including a multiple document interface (MDI) toolbar, status bar and the ability to transfer data via the RS-232 interface in addition to IEEE-488.2. Waveforms are stored on disk as acquisitions, and can be reviewed or played as a series of frames, the time between which can be set by the user. This is a particularly useful facility where there is a requirement for many different acquisitions to be captured and transferred to the PC. Acquisitions can be edited by cutting and pasting frames between files. Transition 2 can be used to produce hard copy on any printer or plotter supported by Windows, with each acquisition being printed on a separate page. |
ProView Analysis Software
FEATURES
|
 |
ProView offers instrument control, analysis and report generation in a single integrated package, providing lightning-fast display, zooming, cursor measurements, and plotting. A Formula Database lets you define custom calculations with over 100 math functions, updated each time new data is available. Views and reports are automatically updated as new data appears. Built-in report generation combines your plots, numeric results, test information and even your company logo and other graphics in professional-looking color reports. Add graphs, results tables, text and images to generate professional color documents with ProView's point-and-click report generator. The easy to use graphical interface ensures almost instantaneous productivity. One-key parameter extraction allows fast and easy access to over 80 mathematical functions. Flexible import and export capability allows data interchange with a wide variety of third party programs. ProView is the most effective means of analyzing data from a Gould DSO.
View II Display & Analysis Software
 |
FEATURES
|
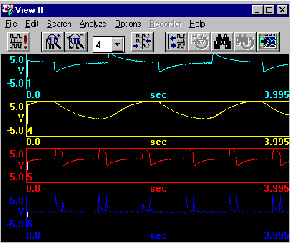
Traditional industrial and life-sciences research applications are analog-trace oriented. Often these applications require an experienced operator to visually interpret charts and manually annotate, analyze and document test results. While these procedures are typically straightforward, it can be difficult to analyze a long chart, to correlate information between signals, or to perform more complex analysis; and creating composite signals is essentially not an option. The View II Signal Analysis software from Gould makes it possible and reasonable to perform a wide range of the above procedures and more with computer speed and accuracy.
Compatibility
The View II software operates with signal data stored on disk/memory card by Gould recorders, data acquisition systems and DSO's and with signal data transferred to PC disk by Gould software.
Signal Display and Manipulation
The View II software operates on all or any portion of 1 to 16 signals. Any length signal recorded on a Gould data acquisition system, recorder or DSO, even signals of different lengths, from a few hundred samples to tens of millions of samples can be operated on by the View II software. For convenient comparison and analysis, these signals can be a mix of signals captured at different times, under different conditions, or from different recorders: a signal from today, yesterday and last year; relatively slow signals from a recorder and faster ones from a DSO. To further ease analysis, the View II software performs all operations and displays all signal information in the signal units recorded when the signals were captured: V, VRMS, % full load, 'C, tons, or whatever.
Basic visual analysis to discern timing and amplitude relationships between signals is required for many signal analysis tasks. The View II software displays each signal within its own display channel in different colors. These display channels can be tiled so that signals are separated or overlapped to optimize signal interpretation; both can help you uncover trends or relationships. Each display channel can be configured using several display attributes: grids, labels, scales, both y-t and x-y formats.
Further manipulation of the displayed signals is sometimes necessary to glean more useful information. Signals can be shifted in time relative to each other to line up points of interest. Y-axis and x-axis expansion/compression functions can show an overview up to the complete signal or detail at critical points. To help make permanent records of your analysis, points of interest can be marked with up to 20 characters of text. This text is attached to the individual sample you specify and is stored with and displayed with that sample.
Searching for Points of Interest
Finding points of interest often requires an experienced operator to visually scan signals and interpret a complex wave shape. This process can be made more efficient by using simple search criteria to jump to a potential point of interest. The View II software's Find function simultaneously searches any combination of the signals for the first occurrence of a signal level, a previously marked point, a point in time, or the trigger point. The Find function searches either forward or backward in the signal record.
Signal Analysis
The View II software provides several tools for signal analysis. The results of all analysis functions are presented in the units of the signal being analyzed.
A cursor is the tool for making amplitude and time measurements. Manual interpretation and long-hand math are no longer required; just position the cursor and read it directly.
Another tool is a set of standard calculations - area, mean, RMS, standard deviation, maximum y, minimum y, etc. that can be performed over a user-specified segment of a signal. The numeric results are displayed in a separate window and can be stored on disk for later report generation.
User-specified equations using standard mathematical operators: +, -, *, /, () plus integration, differentiation, etc. combine existing signals. This powerful tool generates composite signals like power or force and expands the amount of information you can gather from a set of signals. These composite signals can be manipulated just like original signals and saved to disk. And, signals can be manipulated in the frequency domain with FFT, cross correlation, etc.
Default Setups
For any given group of signals, there may be setups that are particular to those signals. Each time these signals are opened, you may want the display scaled to specific values; a specific set of calculations selected; or math equations pre-defined. Any of these configurations can be defined as the View II software's default setup. Also, previously saved setups can be recalled by name to quickly change the View II configuration to a known state.
Report Generation
The task of generating reports can be made easier and more efficient and can produce higher quality results with computer-based tools versus manual report generation. For reporting, the View II software supports copying signal values and graphics to the Windows clipboard and printing. The View II software and the Windows operating system make it a snap to cut and copy a segment of your signal to other Windows based applications.
To copy signal values, select a portion of one or more signals, then, select the Copy function. The View II software will convert the signals to ASCII-text values and place them into either the Windows clipboard or a user specified file. Signal values are organized in columns and separated by tabs. An optional header in the file details all relevant information about the signal data in the file: signal units, full-scale values, offset values, timebase, etc. These text files can be easily imported into word processors, spreadsheets, etc. Most other off-the-shelf analysis software that you may be using should support importing ASCII data files. If you use custom analysis software, these text files are easily interpreted; a header in the file details all relevant information about the signal data in the file. Drag a rectangular rubber band around a portion of the displayed signals to select an area for copying a graphic image. The Copy function then places the image into the Windows Clipboard. Paste this graphic into a graphics/drawing package to add text or other graphical elements. This graphic image can also be pasted into most word-processing documents as part of a complete report.
For printing, the signals and all other information displayed by the View II software can be output to any printer, plotter or other output device supported by the Windows operating system. The View II software does not simply perform a screen dump; the signals are recreated from the signal database at the resolution of the output device to provide as much signal detail as possible.