DataSYS 770A Synchroscope
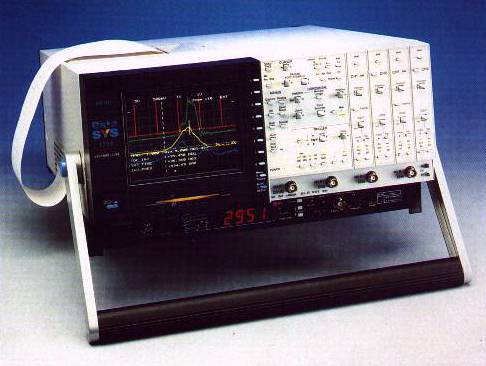 |
Modern engines are much more fuel efficient and produce lower levels of emissions than older engines. In the future, even higher efficiency will be required, at even lower emission levels. One way in which this performance may be achieved is to operate diesel engines at much higher cylinder pressures than used today. The 770A Synchroscope acquires trace data at a nominal resolution of 3600 samples per revolution, allowing detailed examination of injection, and cylinder pressure waveforms. Petrol engine efficiency is affected by ignition timing, and here again the 770A Synchroscope makes it easy to track changes in ignition timing as an engine is run faster or slower. Injection pressures and timing can also be simultaneously measured for varying engine speeds, verifying the performance of the management control system. |
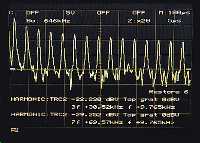 |
Determining the frequency content of a time domain voltage. Oscilloscopes display voltage inputs as functions of time. Spectrum analysers display the frequency content of a signal. The Fast Fourier Transform (FFT), as implemented in DataSYS allows the frequency content of a time domain voltage signal to be determined. The screen display shows an FFT coupled with the automatic harmonic measurements. The measurements are selecting the 3rd and 7th harmonics giving the level in dBV and the frequency of the harmonic coupled with the fundamental frequency (f). The FFT and measurements operate live where the operator can select the particular harmonic to be measured. |
One of the major benefits of the 770A for people working with rotating machines, is the ability to see variables displayed as functions of angular rotation rather than of time. This means that as an engine is run faster or slower changes can be observed in valve timing, for example, directly in degrees of crank rotation. The FFT function can also be scaled in this way, so that engine vibration frequency spectra can be observed as functions of angular rotation speed. The horizontal axis of the FFT can be rescaled to read 1/revolution instead of 1/time.
|
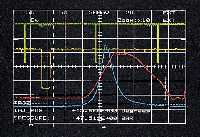
Display of Pressure and position with respect to top dead centre. Cylinder Pressure is directly related to power and can be an indication of valve condition. The screen display shows pressure rescaled to read in "BARs", but it could equally read in PSI, Pascals, etc. The shape of the pressure curve will change as the engine is run faster or slower, for example, or as the fuel / air mixture is altered. The benefit of the triggered, stationary Synchroscope display is that it allows these changed to be observed as a function of angular rotation rather than of time. |
 |