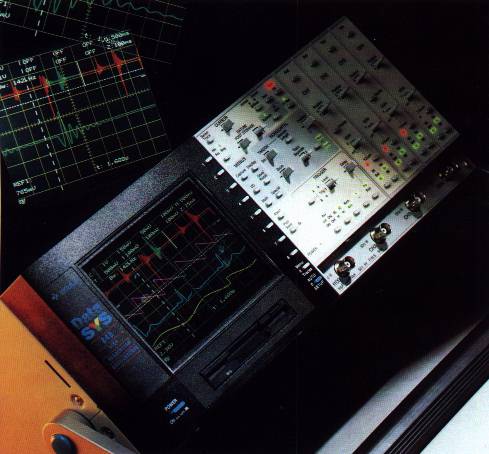
DataSYS 840
 |
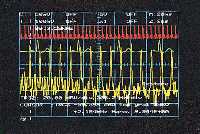
Using a combination of the analysis integration function and X-Y display, the B-H characteristics of magnetic materials can be displayed. By measuring area and using custom measurements, readings of flux can be obtained in the required units. The High Resolution mode is ideal for measuring large variations of signals such as engine pressure at different speeds or nerve responses in medical research. Differentiation is used to find rates of change where the peak of the waveform identifies the maximum. By using Custom Measurements, this point can be used as a reference for other measurements.Spurious glitches, particularly on 50 Hz supply systems, can be difficult to identify and measure.Using the unique Voltage Glitch trigger mode, a single line or a three phase system can be monitored and only waveform data acquired when a glitch occurs on any input. This trigger system is unique because it does not rely on a level setting, therefore detect a glitch occurring at any pointon the 50 Hz waveform. |
12-bit Resolution for FFT
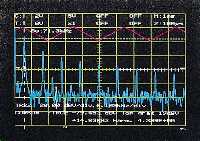 |
The Fast Fourier Transform (FFT) shown indicates that the noise floor is 79 dBV down from the fundamental, clearly showing harmonic detail. The high resolution mode incorporates an anti alias-filter set appropriately on each timebase range to prevent misleading harmonics appearing in the analysis due to sample distortion of the high frequency content. FFT's run live and automatic measurements can be made selecting specified harmonics. |
Also included in the analysis option (121) are differentiation, integration, histogram and graphing functions. Histograms and graphs are used to evaluate performance over a time period by indicating variations and trends of measurements made on the waveforms as they occur.
|
The Classic 6100 with its dual mode of operation provides the flexibility to tackle design and research problems where both high resolution timing or high resolution amplitude analysis of waveforms is required. High resolution voltage capture is ideal for analytical scientific research where its wide dynamic range ensures that the complete signal is acquired - including the fine detail - for in-depth analysis. When tests are one-off events and the maximum signal is unknown, using a wider dynamic range allows the signal to be captured without missing essential small aberrations. |
 |
Measurements are made using the full resolution in both time and voltage. The Custom Measurement option also allows the customization of measurements including input scaling and calculations made in the required engineering units.
The range of mass storage options allows for manual or automatic capture of data that can be copied or transferred to a PC by disk or memory card for further analysis.
In-built plotters give instant records of waveforms or setups or, using the Gould software package Transition 2, full instrument data is quickly transferred into the PC via an appropriate interface where it is stored or incorporated into Microsoft Word® or Excel® documents for compiling reports.
Updated 6 Jan 1997